Optimization Metrics
Over the years, I have considered numerous metrics while working on signal generation projects. Below is a correlation matrix of metric values across many different param values in the backtest output from a directional trading strategy. It is a blend of breakout trading and reversion trading, so the one uncorrelated metric is Win Rate.
Returns: Annualized returns based on margin requirements for the strategy which happens to be in the futures markets.
Win Rate: Percent of winning trades net of all costs.
Profit Factor: Total money made divided by total money lost.
Sharpe: Annualized returns normalized by volatility. (I use monthlies)
Sortino: Annualized returns normalized by downside volatility. (I use monthlies)
Returns/MaxDD: Annualized returns divided by the one single worst drawdown of the out of sample (OOS) equity curve.
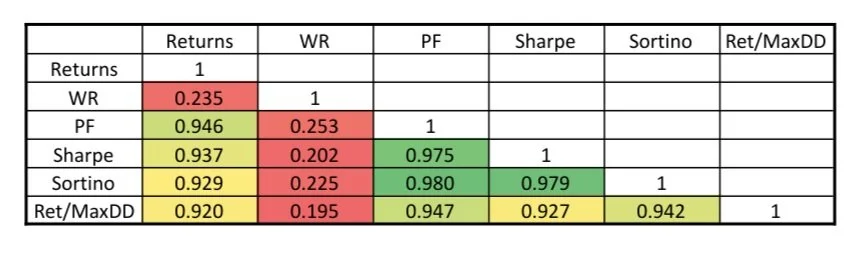
Other than Win Rate, observe how synched up all the metrics are with one another. I used to think I was so clever using Ret/MaxDD: it seems so much better than all the others! At the end of the day, they all usually point to the same results.
Results like this encourage me to focus on robustness and shelf life instead of metrics.
Reach out to learn more about my research and what to prioritize during your discovery process.
Pallino: On Target